
Uncontrolled food costs are the silent margin killer for any restaurant, pub, or hotel. Without rigorous tracking, a food cost percentage creeping from 28% to 34% can erase a venue’s entire net profit, a risk many operators face daily (Source: UKHospitality).
This isn't theoretical. It’s the daily reality for managers wrestling with spreadsheets and paper invoices, often using a manual food cost percentage calculator, trying to pinpoint where money is leaking from the operation.
The financial impact is stark. Industry analysis suggests operational leakage can cost businesses 5% or more of revenue, which for a small restaurant group, can equate to over £180,000 in lost profit annually. This sits within the wider context of the £3.2 billion lost to food waste across the UK hospitality sector each year (Source: WRAP).
This guide is an operational handbook for mastering food cost control. It details the practical systems for recipe costing, supplier management, and variance analysis. Operators who implement this framework can calculate, analyse, and systematically reduce food costs to protect GP margins.
Contents
- What is Food Cost and Why is it a Critical KPI?
- How to Accurately Calculate Food Cost Percentage
- Theoretical vs. Actual Food Cost: Uncovering Hidden Losses
- The Role of Recipe Costing and Menu Engineering
- Mastering Purchasing and Supplier Management
- Effective Stocktaking and Inventory Management
- Implementing a Robust Waste Tracking System
- Using Technology for Tighter Food Cost Control
- Best Practices for Sustainable Food Cost Control
- Food Cost Control Checklist
- Frequently Asked Questions
- Ready to get a firm grip on your restaurant's food costs?
What is Food Cost and Why is it a Critical KPI?
In hospitality, food cost represents the total cost of all food ingredients a restaurant uses to create the dishes it sells over a specific period. It's typically expressed as a percentage of the total food sales revenue generated during that same period. This figure, the food cost percentage, is one of the most critical Key Performance Indicators (KPIs) for any food and beverage operation. It is a direct measure of how efficiently a kitchen converts raw ingredients into profitable sales.
Unlike fixed costs like rent, business rates, or salaried labour, food cost is a variable expense. This means operators have direct, daily control over it. The ability to manage this figure effectively separates profitable venues from those that struggle. While industry benchmarks vary by concept—from under 25% for a pizza restaurant to over 40% for a steakhouse—most UK full-service restaurants aim for a food cost percentage between 28% and 35% (Source: UKHospitality).
Consider a gastropub whose Gross Profit (GP) suddenly drops by three percentage points month-on-month. An experienced General Manager knows this signals a problem in one of three areas: sales prices have dropped, the cost of goods has risen, or stock is disappearing.
Is it a recent supplier price hike on core ingredients? Are new chefs failing to adhere to portion specifications? Or is it something more serious, like unrecorded wastage or even theft? Without a firm grip on food cost calculations, finding the answer is pure guesswork.
How to Accurately Calculate Food Cost Percentage
Calculating your food cost percentage accurately is the first step toward controlling it. While the concept is simple, precision is essential. Any inaccuracies in the data will render the final percentage meaningless, leading to poor decision-making. The standard formula, which a food cost percentage calculator automates, is a measure of Cost of Goods Sold (COGS) as a percentage of revenue.
The Food Cost Formula:
(Beginning Inventory + Purchases – Ending Inventory) / Total Food Sales = Food Cost Percentage
Let's break down each component:
- Beginning Inventory: This is the total monetary value of all food stock on hand at the very start of the accounting period (e.g., midnight on the 1st of the month). This figure is the same as the 'Ending Inventory' from the previous period.
- Purchases: This is the total value of all food products purchased during the period. Crucially, this figure should be your net cost, excluding VAT, to ensure a like-for-like comparison against your ex. VAT sales figures. Remember to also exclude non-food items like cleaning supplies.
- Ending Inventory: This is the total monetary value of all food stock remaining at the very end of the accounting period (e.g., 11:59 PM on the last day of the month). An accurate stocktake is non-negotiable here. A guide on how to calculate COGS for your restaurant can provide deeper insights.
- Total Food Sales: This is the revenue generated exclusively from food sales during the period. It is critical to exclude beverage sales, service charges, and VAT from this figure to avoid skewing the calculation.
Worked Example:
A restaurant starts the month with £15,000 of food stock. Over the month, it purchases an additional £10,000 of ingredients. At the end of the month, a full stocktake reveals £12,000 of stock remains. During that same month, the restaurant's food sales were £85,000 (ex. VAT).
- Beginning Inventory: £15,000
- Purchases: £10,000
- Ending Inventory: £12,000
- Food Sales: £85,000
Calculation: `(£15,000 + £10,000 - £12,000) / £85,000 = £13,000 / £85,000 = 0.1529`
Food Cost Percentage = 15.3%
Theoretical vs. Actual Food Cost: Uncovering Hidden Losses
Beyond using a basic food cost percentage calculator, the most effective operators go a level deeper by comparing their 'actual' food cost to their 'theoretical' food cost. The gap between these two figures, known as variance, is where unexplained losses—and hidden profit opportunities—reside. Mastering this comparison is a cornerstone of professional hospitality inventory management.
Defining the Terms
- Theoretical Food Cost: This is what your food cost *should* be in a perfect world. It's calculated by multiplying the number of each dish sold (from your POS data) by the exact cost of the ingredients in that dish's recipe. It assumes perfect portioning, zero waste, and no theft.
- Actual Food Cost: This is the figure calculated using the standard COGS formula from the previous section. It reflects what you *actually* used based on inventory movement and purchases.
Analysing the Variance
In any real-world kitchen, the actual food cost will always be higher than the theoretical cost. The key is to keep this variance as small as possible, typically aiming for 2% or less, according to industry best practices (Source: UKHospitality). A significant variance points directly to operational inefficiencies and profit leakage.
Common causes for a high variance include:
- Waste: Ingredient spoilage, kitchen errors, over-prepping, or returned dishes that aren't logged.
- Inconsistent Portioning: Chefs adding an extra handful of cheese or a larger piece of fish than the recipe specifies. These small deviations multiply across hundreds of covers.
- Unrecorded Items: Complimentary dishes for VIPs, staff meals, or items used for menu testing that are not properly accounted for.
- Shrinkage & Theft: Ingredients that go missing, either through petty theft or being discarded without being recorded.
For example, a head chef at a 100-seat restaurant calculates a theoretical food cost of 28% for the month. However, the actual food cost comes in at 33%. This 5% variance on £100,000 in monthly food sales represents £5,000 in lost profit.
Investigating further, the chef discovers that line cooks, under pressure during service, were not using scales, leading to portion sizes creeping up by 10-15% on key dishes. This insight allows for immediate retraining and a tightening of kitchen procedures.
The Role of Recipe Costing and Menu Engineering
Accurate food cost control is impossible without precise, up-to-date recipe costing. This process is the foundation upon which all menu pricing, purchasing decisions, and profitability analysis are built. A casual approach to recipe costing—or worse, relying on old spreadsheets—directly leads to eroded margins as supplier prices fluctuate.
Dynamic Recipe Costing
A recipe cost card should detail every single ingredient in a dish, measured by weight or volume, down to the pinch of salt and dash of oil. Historically, this was done in Excel.
The critical flaw in this method is that supplier prices are not static; food price inflation can significantly alter costs week to week (Source: Office for National Statistics). Manually updating hundreds of recipes in a spreadsheet every time a supplier sends a new price list is impractical.
This is where modern inventory platforms provide a significant advantage. Systems like growyze capture supplier invoices and consequently supplier price changes, enabling live recipe costing. When the price of flour or cooking oil increases, the cost of every recipe using that ingredient is automatically updated. This gives chefs and managers real-time visibility into the true cost and GP margin of every dish on the menu, enabling them to make smarter, data-driven pricing decisions.
Strategic Menu Engineering
Once you have accurate recipe costs, you can perform menu engineering analysis. This involves categorising each menu item into one of four quadrants based on its popularity (number sold) and its profitability (contribution margin).
Category vs Popularity vs Profitability vs Action
Star
- Popularity: High
- Profitability: High
- Action: Protect and promote. These are your winners.
Ploughhorse
- Popularity: High
- Profitability: Low
- Action: Popular but not very profitable. Try to increase price slightly or re-engineer the recipe to reduce its cost.
Puzzle
- Popularity: Low
- Profitability: High
- Action: High-margin dishes that don't sell well. Reposition on the menu, use better photography, or train staff to recommend them.
Dog
- Popularity: Low
- Profitability: Low
- Action: Your losers. Consider removing them from the menu or radically re-engineering them.
For instance, a restaurant may find its signature burger is a 'Ploughhorse'. It's incredibly popular but has a low contribution margin. By switching to a slightly more cost-effective bun and reducing the cheese portion by 5g—a change imperceptible to customers—they could improve its margin by 50p per unit. Across 500 burgers sold a week, that’s an extra £13,000 in profit per year. This level of analysis is covered in a guide to profitable menu engineering.
Mastering Purchasing and Supplier Management
Your relationship with suppliers and the rigour of your purchasing process are direct levers for food cost control. A disorganised approach to ordering and receiving goods is a common source of profit leakage, from paying for items you never received to missing out on better pricing. Effective supplier management is about creating a structured, transparent, and accountable system.
Centralised Purchasing and Order Management
For multi-site operators, allowing individual chefs or managers to order from different suppliers at varying prices is a recipe for chaos and inflated costs. The best practice is to centralise purchasing by negotiating prices for a core list of products with a select group of approved suppliers. This gives the business greater buying power and ensures consistency across all locations.
Every order should begin with a digital Purchase Order (PO). A PO is a formal document specifying the exact items, quantities, and agreed prices. This eliminates ambiguity and provides a clear record to check against when the delivery arrives. Relying on text messages or verbal orders to suppliers is highly prone to error and offers no audit trail when disputes arise.
The Power of Three-Way Invoice Matching
The single most important control in the purchasing cycle is three-way invoice matching and reconciliation. This is the process of verifying that the data on three separate documents aligns perfectly:
- The Purchase Order (PO): What you requested.
- The Delivery Note: What the supplier claims to have delivered.
- The Invoice: What the supplier is charging you for.
Manually performing this check is tedious and often gets skipped during a busy service. A chef might sign for a delivery without meticulously checking every line item against the PO. This is how errors slip through. For example, a delivery arrives 15% short on a high-cost item like salmon, but the invoice reflects the full original order. Without a rigorous check, the restaurant pays for fish it never received.
This is a problem that technology solves effectively. Platforms built for hospitality, like growyze, offer automated three-way invoice matching. The system digitises all three documents and flags any discrepancies—price differences, quantity shortfalls, or un-ordered items—instantly. This ensures you only pay for what you actually ordered and received, catching costly errors that would otherwise go unnoticed and saving administrative teams hours of manual verification.
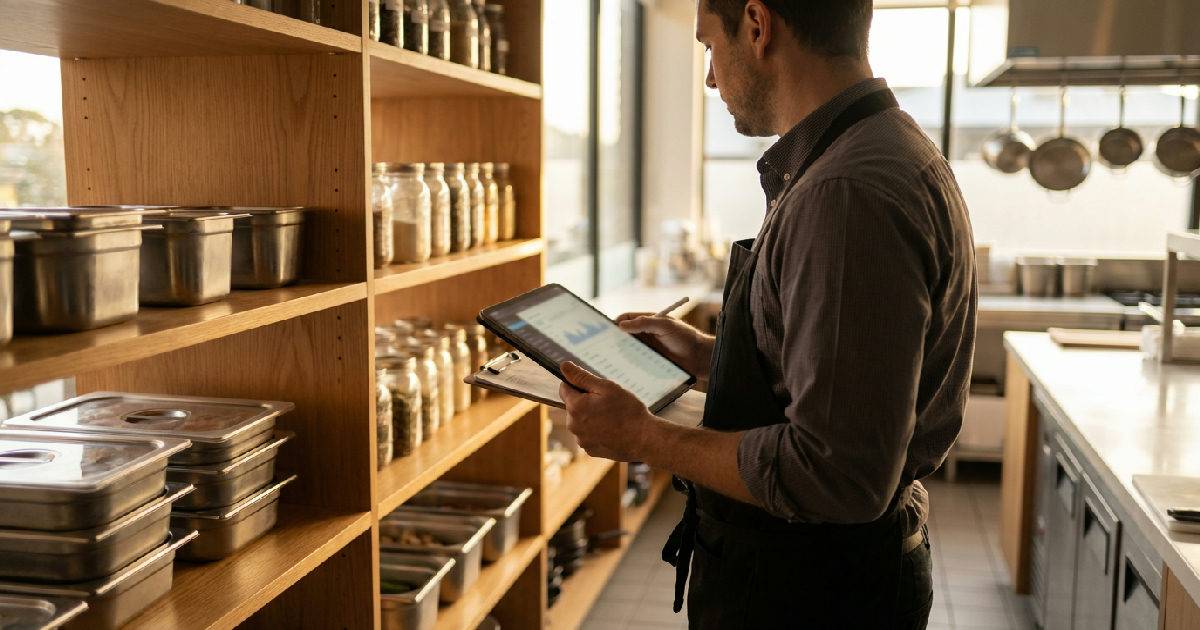
Effective Stocktaking and Inventory Management
Accurate and efficient stocktaking is the backbone of food cost control. It is the physical verification of your theoretical data. Without knowing exactly what you have on your shelves, in your fridges, and in your freezers, calculating an accurate food cost is impossible. Yet, for many operators, the stocktake remains a dreaded, time-consuming task associated with late nights and cumbersome spreadsheets.
Digitising the Stocktake Process
The traditional "shelf-to-sheet" method, where one person calls out items and another writes them on a clipboard, is slow, disruptive, and highly susceptible to human error. These paper counts then need to be manually typed into a spreadsheet for valuation, introducing another opportunity for mistakes. For multi-site restaurant groups, the challenge is magnified, as an ops director might wait days for all sites to submit their spreadsheets before a consolidated view is possible.
Modern barcode scanning apps transform this process. Using a smartphone or tablet, staff can simply scan the barcode of each product and enter the count. This method is substantially faster than manual counting and eliminates transcription errors.
The data syncs directly to a central platform, providing management with an instant, accurate valuation of stock on hand across one or multiple venues. For complex operations like hotels, this technology has been shown to reduce stocktake times from days to mere hours, as demonstrated by the experience of operators digitising thousands of products across their properties.
PAR Levels and Smart Reordering
Effective inventory management goes beyond just counting; it involves optimising stock levels. PAR (Periodic Automatic Replacement) levels are the minimum amount of an item you need on hand to meet demand between deliveries. Setting these levels correctly is crucial:
- Too high: You tie up cash in excess stock, increase the risk of spoilage and waste, and require more storage space.
- Too low: You risk running out of a key ingredient, leading to 86'd menu items and lost sales, particularly damaging during peak service.
Instead of relying on guesswork, PAR levels should be set using historical sales data. An inventory management system can analyse sales velocity from your POS to recommend optimised PAR levels. When stock drops below this level, the system can automatically generate a suggested purchase order, streamlining the reordering process and ensuring you hold the optimal amount of stock to maximise sales while minimising waste. This data-driven approach is explored further in the guide on managing stocktaking across multiple venues.
Implementing a Robust Waste Tracking System
Food waste is a direct drain on your profits. Every time an ingredient is thrown away, you lose not only its purchase cost but also the potential revenue it could have generated. The scale of this issue is immense; according to WRAP, 75% of the 1.1 million tonnes of food wasted by the UK hospitality sector each year is avoidable (Source: WRAP). Implementing a systematic waste tracking system is the only way to understand and reduce this loss.
Categorising Waste for Actionable Insights
To effectively tackle waste, you first need to measure it. Simply noting the total value of waste is not enough; you must categorise the reason for it. This allows you to identify patterns and address the root cause. A good system will track waste across several key categories:
- Spoilage: Items that went past their use-by date due to over-ordering or poor stock rotation (FIFO - First-In, First-Out).
- Preparation Waste: Mistakes during the prep process, such as burnt items, incorrect recipes, or excessive trimming.
- Plating/Customer Error: Food that is dropped, plated incorrectly, or sent back from a table for reasons of quality or customer complaint.
- Staff Meals & Other: Items used for staff food, menu testing, or other purposes that need to be accounted for but weren't sold.
A scenario seen in many kitchens is the introduction of a digital waste log. A restaurant team, previously using a neglected clipboard, starts logging waste on a kitchen tablet. Within two weeks, the data reveals that over £200 of fresh herbs are being discarded weekly due to spoilage. Realising they are over-ordering, the head chef adjusts the PAR level for herbs, immediately cutting waste and saving over £10,000 annually.
From Paper Sheets to Digital Logs
The traditional paper wastage sheet tacked to a fridge door is often forgotten during a frantic service. This leads to under-reporting and an incomplete picture of the problem. Digital waste tracking, integrated into a broader inventory management platform, makes logging waste simple and consistent.
Kitchen staff can quickly record a wasted item on a tablet, assigning a reason from a pre-defined list. The system automatically deducts the item from inventory and attributes its cost to the appropriate waste category, providing chefs and managers with a real-time dashboard of waste-related losses.
Using Technology for Tighter Food Cost Control
While the principles of food cost control are timeless, the tools available to implement them have evolved dramatically. Relying on fragmented spreadsheets, paper invoices, and manual data entry is no longer a viable strategy for a modern hospitality business. Integrated technology platforms provide the accuracy, speed, and real-time visibility needed to effectively manage margins in a challenging market.
Moving Beyond Spreadsheets
For many small to medium-sized operators, Microsoft Excel has been the default tool for everything from recipe costing to stocktaking. Dedicated inventory management platforms are built to overcome these challenges, as detailed in the growyze vs. Spreadsheets analysis.
Feature vs Spreadsheets (Excel/Google Sheets) vs Inventory Management Software
Recipe Costing
- Spreadsheets (Excel/Google Sheets): Static. Must be manually updated. Prone to formula errors.
- Inventory Management Software: Dynamic. Costs update automatically with supplier price changes.
Invoice Processing
- Spreadsheets (Excel/Google Sheets): Manual checks required. Time-consuming and error-prone.
- Inventory Management Software: Automated three-way matching flags price and quantity errors instantly.
Stocktaking
- Spreadsheets (Excel/Google Sheets): Manual pen-and-paper counts. Slow and requires manual data entry.
- Inventory Management Software: Fast barcode scanning via mobile app. Instant, accurate valuations.
Waste Tracking
- Spreadsheets (Excel/Google Sheets): Often relies on paper sheets. Data is disconnected and hard to analyse.
- Inventory Management Software: Integrated digital logs. Real-time dashboards show waste costs by reason.
Multi-Site Reporting
- Spreadsheets (Excel/Google Sheets): Requires manual consolidation of multiple files. Days of admin work.
- Inventory Management Software: Centralised dashboard gives instant, consolidated view of all venues.
Spreadsheets are static, meaning a recipe cost calculated in January is dangerously out of date by March when supplier prices have increased. They are also highly prone to manual error—a single broken formula or copy-paste mistake can silently corrupt an entire stock valuation. For multi-site groups, consolidating data from various spreadsheets into a single report is a time-consuming administrative task that can take days.
The Power of Integration and a Single Source of Truth
The true power of a modern system lies in its ability to connect different parts of the operation. By implementing a platform that offers deep integrations with your POS and accounting software (such as Xero or Sage), you create a flow of data.
This connected ecosystem works as follows: sales data flows from the POS into the inventory platform, which automatically depletes stock based on recipes sold (your theoretical usage). Purchase orders, deliveries, and invoices are managed within the same system, tracking all incoming stock. The platform can then push finalised, coded invoice data directly into your accounting software.
This creates a single, reliable source of truth, eliminating data silos and giving you a complete, real-time view of your costs and margins. It's this operational visibility that allows a finance director to close month-end accounts faster and a GM to understand their kitchen's Gross Profit in real-time.
Platforms like growyze were specifically built by hospitality veterans to solve this exact fragmentation problem for UK operators.
Best Practices for Sustainable Food Cost Control
Achieving and maintaining control over food costs requires consistent application of best practices across the entire team. It is a continuous process of measurement, analysis, and refinement, not a one-time fix. Here are essential practices that successful operators embed into their daily and weekly routines.
- Standardise and Document Every Recipe: Create a detailed recipe card for every single item on your menu, including portion sizes in grams and millilitres, and make it accessible to all kitchen staff. This ensures consistency and is the baseline for all theoretical cost calculations.
- Conduct Weekly Variance Reporting: Don't wait until month-end to discover a problem. Run a weekly report comparing your theoretical food cost (from sales) against your actual food usage (from a short-form stock count of key items). This allows you to spot and correct issues like over-portioning or waste within days, not weeks.
- Train Staff on Portion Control and Waste Logging: Your team is on the front line of cost control. Provide them with the right tools (scales, measures) and train them on the financial impact of their actions. Make waste logging a mandatory, easy-to-follow part of the kitchen workflow.
- Implement Rigorous Receiving Procedures: Never allow an invoice to be paid without first checking the delivery note against the original purchase order. Train staff to meticulously check for short-dated stock, incorrect quantities, or substitutions upon delivery.
- Review Menu Pricing Against Live Costs Quarterly: Food costs are not static. Schedule a quarterly menu review where you analyse the GP margin of every dish based on the latest supplier pricing. This ensures your pricing strategy remains profitable in the face of inflation.
- Optimise Inventory with Data-Driven PAR Levels: Use sales data from your POS to set and regularly adjust PAR levels for all ingredients. This prevents cash from being tied up in slow-moving stock and reduces the risk of spoilage.
- Embrace FIFO (First-In, First-Out): Enforce a strict stock rotation system in all storage areas. New stock must always be placed behind existing stock to ensure older items are used first, minimising spoilage waste.
- Analyse Your "Dog" and "Ploughhorse" Items: Regularly perform menu engineering analysis to identify low-profit items. Work to re-engineer these dishes to improve their margin or, if they are also unpopular ('Dogs'), remove them from the menu. Improving the profitability of your popular 'Ploughhorses' can have a huge impact on overall GP, a topic explored in the guide to kitchen gross profit.
Food Cost Control Checklist
Use this checklist to embed consistent food cost control into the operation. These are the core routines that separate high-margin venues from those constantly fighting profit leaks.
Daily Tasks
- Enforce portion control using scales and measures for every dish.
- Log all food waste accurately, assigning a reason (spoilage, prep error, etc.).
- Check all incoming deliveries against the delivery note and purchase order before signing.
Weekly Tasks
- Conduct stock counts on key high-value items (e.g., proteins, dairy).
- Analyse variance reports to compare actual vs. theoretical food cost. Investigate discrepancies.
- Review sales data to identify slow-moving items and inform prep levels.
Monthly & Quarterly Tasks
- Perform a full wall-to-wall stocktake for accurate month-end accounting.
- Review and update menu pricing based on current, live-costed recipes.
- Perform a menu engineering analysis to identify 'Stars', 'Puzzles', 'Ploughhorses', and 'Dogs'.
Frequently Asked Questions
What is a good food cost percentage for a UK restaurant?
A typical food cost percentage for a full-service restaurant in the UK is between 28% and 35% (Source: UKHospitality). However, this varies significantly by concept. A pizza or pasta restaurant with low-cost base ingredients may aim for under 25%, while a high-end steakhouse using premium cuts of meat could operate with a food cost of 40% or more, balancing it with higher menu prices.
How can I reduce food cost without sacrificing quality?
Reducing costs should focus on eliminating inefficiency, not compromising on the quality of ingredients which can damage your brand. The most effective strategies are minimising waste through better tracking, enforcing strict portion control, negotiating better prices with suppliers through consolidated purchasing, and using menu engineering to promote high-margin dishes.
How often should I do a full stocktake?
For optimal control, experienced operators recommend weekly counts for high-value, fast-moving items (like fresh protein, dairy, and key lines). A full, wall-to-wall stocktake should be performed at least once per month to provide the data needed for accurate financial reporting. The more frequent your counts, the faster you can identify and resolve inventory variances.
What is the biggest mistake restaurants make with food costs?
The most common and costly mistake is relying on static, outdated recipe costs, often stored in a spreadsheet. Supplier prices are dynamic, and if your menu prices are based on costs from six months ago, you are likely losing margin on every sale. The second major error is failing to analyse the variance between theoretical and actual food costs, which means you have no visibility on losses from waste, theft, and portioning errors.
Sources
- WRAP – Food waste in the UK hospitality and food service sector
- UKHospitality – Industry benchmarks and guidance
- Office for National Statistics – Consumer and food price inflation data
Ready to get a firm grip on your restaurant's food costs?
Managing food costs using spreadsheets and paper invoices is a constant battle against inaccurate data and hidden losses. You know that single-digit percentage point improvements in your GP margin can add tens of thousands of pounds to your bottom line, but finding those savings without real-time visibility is nearly impossible. The time spent manually chasing invoices, updating recipe costs, and consolidating stock reports is time you're not spending on the floor or developing your business.
Purpose-built platforms like growyze were designed by hospitality operators to solve these exact frustrations. By connecting your purchasing, inventory, recipe costing, and waste management into a single system that integrates with your POS and accounting software, you gain the clarity needed to control costs effectively.
It replaces hours of weekly admin with automated processes, giving you and your team the data to make smarter decisions that directly protect your profit margin. To see how this works in a real operational environment, Book a demo with growyze.


